A temperature reading appears on a dashboard. An alarm triggers in a monitoring platform. An energy management application reports unexpected consumption.
The data is there. The question is whether anyone knows where it came from.
In today’s connected facilities, information rarely travels directly from a sensor to a screen. A single value may pass through a controller, a protocol gateway, a building management system, a cloud platform, and two or three downstream applications before it reaches the person who needs it.
When everything is working, that complexity stays out of sight. When something goes wrong, that complexity can’t be unseen.
Why Troubleshooting Connected Buildings Can Be Difficult
When a value stops updating, an alarm never arrives, or a trend line suddenly goes sideways, troubleshooting stops being about the device and starts being about the path.
Where did it originate?
The source device seems like the obvious starting point, but in a connected system, even identifying the true origin can take time.
How many systems handled it?
Every handoff is a potential failure point. The more systems in the chain, the more places the investigation has to go.
Where did it change form?
Protocol translation, normalization, renaming. Each layer can alter the data in ways that make it harder to recognize downstream.
Where did it stop?
Sometimes data doesn’t disappear. It just stops moving and finding where the chain broke is its own investigation.
Many integrators have a name for this phenomenon: ghost data. Not because the data doesn’t exist, but because nobody is entirely sure where it came from, how it was transformed, or what happened to it along the way. The more devices, platforms, and cloud services in the mix, the harder it gets to find out.
More Connections, More Places to Look
Twenty years ago, troubleshooting a communication failure meant checking a limited number of systems running a limited number of protocols. The path was short—and so was the investigation.
Not today. A single data point may pass through a protocol gateway, get normalized inside a building management system, forwarded to a cloud platform, processed by analytics software, and then appear in multiple dashboards. Each step adds value but it’s also another place where something can go wrong.
A communication issue may originate at the source device. A mapping error may occur during protocol translation. A cloud application may be pulling from an outdated tag. A dashboard may be displaying the wrong value because of a naming conflict introduced years earlier.
Most integrators recognize the result: everyone can see the problem, but nobody can immediately say where it lives.
Data Rarely Keeps Its Original Identity
One reason troubleshooting becomes difficult is that data changes as it moves.
A sensor starts with one identifier inside a controller. A gateway maps it to a different name. The gateway then publishes it using a different structure, and a cloud platform applies its own naming convention before the value surfaces in an application.
After several layers of translation, the original source can be nearly unrecognizable. Engineers find themselves asking questions that should already have answers—whether that value is original or calculated, which device generated it, whether it was renamed during integration, and which system is authoritative.
If it takes more than a minute to answer any of those, it may indicate a ghost data problem.
The Hidden Cost of Naming
A large share of debugging problems start with naming conventions.
Consider two data points containing the same value:
- Temp_01
- Building_A/Floor_2/AHU_3/Supply_Air_Temperature
The first made perfect sense to the engineer who created it but that engineer may no longer be involved. Years later, nobody remembers what Temp_01 represents, where it originates, or whether it is still connected to the correct source.
The second tells a story. It identifies the location, equipment, and purpose so operators, engineers, and future integrators can understand what they’re looking at without digging through documentation.
As systems grow, naming conventions stop being an organizational preference and instead become a diagnostic tool. A well-designed structure reduces the number of questions engineers need to ask when something goes wrong, yet a poor one turns every investigation into detective work.
Why MQTT Topic Structure Is a Debugging Asset
MQTT is often discussed in terms of efficiency and scalability. Less attention is given to one of its most practical benefits: preserving data lineage as information moves between systems.
A well-structured MQTT topic communicates something before anyone even looks at the value. A topic like BuildingA/Floor2/AHU3/SupplyAirTemperature tells an engineer where the data originated and how it relates to other points in the system. When a value disappears or behaves unexpectedly, that structure gives teams a starting point.
Generic identifiers or inconsistent conventions deliver the data without the supporting information needed to identify its origin. Understanding the origin often comes down to tribal knowledge that walks out the door when personnel change.
Structured topics typically act as a breadcrumb trail back to the source.
Take, for example, an MSA FieldServer gateway. It supports MQTT alongside more than 140 protocols, helping integrators maintain consistent data structures across building automation, industrial, and energy management systems.
When the Gateway Isn’t the Problem, It’s Where You Look First
Protocol gateways exist because systems speak different languages. A gateway receives data from one protocol, translates it, and forwards it to another system. Most of the time, that works exactly as intended.
Occasionally, it becomes part of the problem if a point is mapped incorrectly, a data type doesn’t match what the destination expects, or a naming convention changes during translation and nobody documents it.
The result is data that exists but no longer behaves as expected.
Because gateways sit between systems, they’re usually the first place engineers look when something breaks. That instinct is understandable, but gateways are often not where the problem started. They’re where it becomes visible.
This is where gateway diagnostics earn their value. FieldServer gateways provide communication status, point mapping visibility, and diagnostic information across connected protocols, and can help integrators determine whether the issue is upstream, downstream, or in the translation layer itself. In a multi-protocol environment connecting HVAC, fire panels, lighting, and energy systems, that may reduce troubleshooting time considerably.
The Documentation Problem Nobody Plans For
Many debugging challenges have less to do with technology than with what was never written down.
Things happen: buildings change ownership, equipment gets upgraded, integrators move on, and platforms get replaced. When personnel change or documentation is incomplete, teams can spend hours tracing data flows that otherwise could have been resolved in minutes.
The problem compounds when multiple vendors have worked on the same system, each following different standards and leaving behind different levels of documentation.
Data keeps flowing yet understanding it becomes progressively more difficult.
Troubleshooting Begins Long Before Something Breaks
Most organizations treat troubleshooting as a reactive activity. Something fails, then the investigation starts.
The ability to troubleshoot effectively is usually determined long before any failure occurs.
Clear naming conventions, structured topic hierarchies, documented data flows, and consistent tagging practices can help make future debugging faster. Poor naming, incomplete documentation, and undefined data ownership create conditions where straightforward issues become difficult to diagnose.
The difference shows up clearly after something stops working. For example, one team traces a data point from source to destination in 20 minutes. Another spends two days chasing a value through multiple systems trying to figure out where it originated. The technology may be nearly identical. What differs is how much visibility was built in from the start.
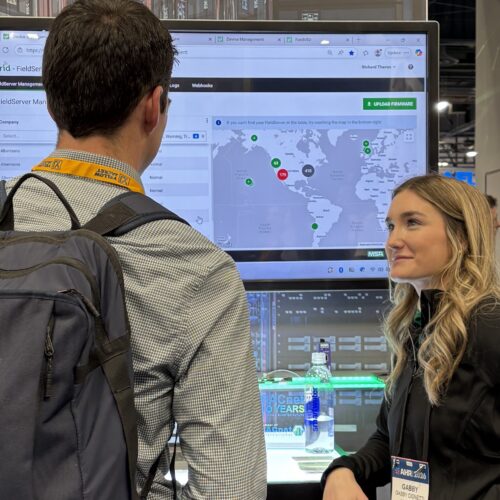
FieldServer Manager supports that visibility beyond the job site. Integrators can remotely monitor communication status, receive alarm notifications, and access cloud dashboards across deployed gateways, which means documentation gaps and configuration issues often surface before they become field problems.
Questions Worth Asking Before the Next Integration Project
Before deployment, integrators and facility teams should think beyond whether systems can communicate and consider how easily those systems can be understood and supported over time.
- How will data be named and organized across systems?
- Will topic structures provide enough context to identify the source of a value?
- Where will point mappings be documented?
- Can operators trace a value from the dashboard back to the originating device?
- What diagnostic tools will be available when communication issues occur?
- Who is responsible for maintaining documentation as the system evolves?
If these questions are difficult to answer during design, they will be significantly harder to answer during a live troubleshooting situation.
Building Systems That Are Easier to Understand
The problem in connected facilities is no longer collecting data. Most facilities have more data than they can act on. The challenge is understanding where the data came from, how it moved through the system, and whether it can be trusted.
That means naming conventions designed to stay useful years after deployment. Data flows documented before they become institutional knowledge held by one person. Integration tools that show how data is moving, not just that it arrived.
Protocol gateways often sit at the intersection of the building, industrial, and energy systems where ghost data issues often become visible. Visibility into communication status, point mappings, and diagnostic information can help provide a faster path from symptom to source. Through FieldServer gateways and FieldServer Manager, teams can monitor communications and may be able to identify issues earlier, reducing the time spent tracing data flow.
If your team is planning a new integration or working through a data-tracing problem now, contact us to talk through your application.
Recommended for You